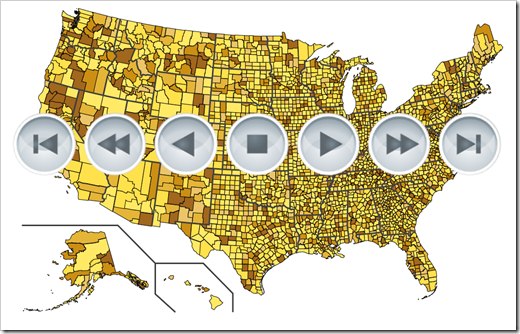
How to create an animated Choropleth Map (aka Heat Map, Filled Map, Thematic Map or Statistical Map) in Microsoft Excel
1.006 words, ~5 minutes read
In one of the recent articles (All Peaks of the Alps visualized in Excel), I tried to show how to combine different advanced techniques in Microsoft Excel (posted here or elsewhere) to create highly interactive Excel dashboards.
I will tell you no lies: that one was a washout. The interest in that post and workbook was next to nothing. Now, you certainly expect I would have learned my lesson and try something else. I did learn something, but the stubborn old man I am, I can’t let it go yet. Thus, I decided to give the idea another shot.
Animated Choropleth or Heat Maps have become quite popular, especially in the past few weeks. So, there is nothing more obvious than providing a template with an animated Choropleth Map in Excel, is it?

Today’s post will briefly explain how to combine two advanced Excel techniques which have already been published here: a Choropleth Map and the animation of visualizations in Excel.
As always, the article comes with the workbooks for free download: an animated map of Germany by districts (Kreise und kreisfreie Städte) and one of the United States by counties.