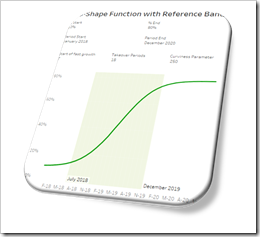
How to create a customizable S-shaped Function in Tableau
 The speed of adoption of an innovation usually follows an S-shaped function. Such a function shows an initial exponential growth until the inflection point, followed by an exponential decay until it converges to an upper target value. In other words, a curve looking like an S-shaped pattern.
Typical examples for business measures following an S-shaped function are adoption rates of new products, market shares of new companies, the effects of new processes or new organizational practices and the like.
Providing a customizable (i.e. user-defined) S-shaped function in a Tableau workbook can be very helpful across all stages of advanced analytics: in descriptive and diagnostic analyses, the S-shaped function can be used as a customizable reference line for the actual historical development and for analyzing deviations. In predictive and prescriptive analytics, the S-shaped function can be used to model and forecast expected future developments and to perform sensitivity and what-if analyses.
Having a ready to use S-shaped function in Tableau is a must-have for your Advanced Analytics Toolbox.
Today’s post provides a Tableau workbook template with a fully flexible user-defined S-shaped function. The workbook is published on Tableau Public and also available for free download.