• Microsoft Excel VBA Progress Indicators

    Options for displaying a Progress Indicator in Microsoft Excel during time consuming VBA procedures and a Speed Comparison of the different approaches

    Progress / Photographer: David Ingram (flickr.com)If your Excel model includes time consuming VBA procedures or algorithms, you certainly want to update the users about the progress of the code. In principle, there are three different approaches: you can either update Excel’s Status Bar at the bottom left of the Excel window, use a dedicated cell range or an object (e.g. a chart) directly on the active worksheet and update the cells by VBA or simply display a VBA user form showing a progress bar.

    Today’s article presents a selection of examples for each of these approaches, discusses their pros and cons and compares the techniques regarding the additional runtime to show the progress indicator. As always, the post comes with a link to the used Progress Indicators Speed Comparison Tool for free download.

    (more…)

  • Excel VBA Read and Write Performance Test

    What is the fastest way to read values from and write values to an Excel worksheet with VBA? And how much faster is it?

    Stop Watch / Photographer: Leo Reynolds (flickr.com)The most common and most effective recommendations to speed up slowly running VBA code in Excel are the following four:

    1. Turn off the screen updating while the code is running

    2. Set Excel’s calculation mode to manual while the code is running

    3. Don’t select (activate) objects (ranges, charts, shapes, etc.)

    4. Optimize the way of reading values from and writing values to the worksheet. Instead of looping through a range, read or write the entire block of data in one go with one single statement.

    Well, you have seen those before, right? Nothing new under the sun.

    However, how much can you speed up your code with these best practices?

    Well, for the screen updating and the calculation mode, it depends on how your specific workbook looks like. The more complex the display is (i.e. how much rendering Excel has to do to update the screen?) and the more and more complicated formulas you have in your workbook (i.e. how long does one recalculation take?), the higher the performance gain will be. Thus, it is hard to provide universally valid numbers on the potential performance increase.

    With regards to the avoidance of Select statements and the method of transferring data between Excel and VBA, however, a more or less generic test environment is possible.

    Today’s post provides a small Performance Test Tool to demonstrate how much faster your VBA code can be, if you are using the best method to read data from or write data to an Excel worksheet using VBA. As always, the article comes with the Excel workbook for free download.

    (more…)

  • Mouse Driven Actions on Excel Dashboards

    Add context and interactivity to your Excel Dashboards with mouse hovering and clicking actions

    Mouse driven Action Dashboard in ExcelThe previous posts Customizable Tooltips on Excel Charts and User-defined Excel Chart Tooltips showed how to provide insightful tooltips when hovering over a data point on an Excel chart.

    The idea and its implementation can be taken one step further: instead of displaying a tooltip, hovering over or clicking on a data point of an Excel chart can send this information across your dashboard to other views (charts or cell ranges). I.e. you can select one data point out of many in one view and display detailed information on this selected data point in other views.

    My other favorite data analysis and data visualization application, Tableau Software, calls this an action. This is a fantastic feature for data exploration and analysis, especially for larger data sets.

    Today’s post shows how to mimic Tableau’s mouse hovering or mouse selecting actions on an Excel dashboard. As always, the Excel workbook is provided for free download.

    (more…)

  • S-Shaped Function in Microsoft Excel

    A ready-to-use template for an S-shaped Function in Excel

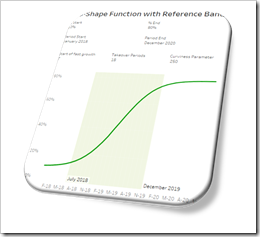
    S-shaped function ExcelThe previous post S-Shaped Function in Tableau discussed and provided the implementation of a customizable, i.e. user-defined S-shaped function in Tableau Software.

    In the introduction to this post I wrote: “Having a ready to use S-shaped function in Tableau is a must-have for your Advanced Analytics Toolbox.”

    This applies to Microsoft Excel, too. Maybe even more.

    There are quite a few different S-shaped functions in Excel available on the Internet. The first implementation I saw was a post by Juan C. Mendez back in 2007. Unfortunately Juan’s site is down now, but an archived version is still available here. Others built upon Juan’s approach, like Mathias over at Clear Lines Consulting and this site is still up.

    Juan and Mathias used a different formula than I do (in Tableau and in Excel), but the result is pretty much the same. The only new feature in my implementation is the option to highlight the period of fast growth of the S-shaped function with a reference band.

    So, nothing really new under the sun in this post, but – for the sake of completeness – here is my Microsoft Excel template of an S-shaped function for free download:

    Download S-shaped Function (Microsoft Excel 2007-2016 workbook, 26K)

    If you are interested in how to use the parameters to shape the curve, please refer to the previous post S-Shaped Function in Tableau.

    More things to come soon.

    Stay tuned.

  • S-Shaped Function in Tableau

    How to create a customizable S-shaped Function in Tableau

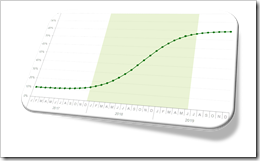
    S-shaped function in TableauThe speed of adoption of an innovation usually follows an S-shaped function. Such a function shows an initial exponential growth until the inflection point, followed by an exponential decay until it converges to an upper target value. In other words, a curve looking like an S-shaped pattern.

    Typical examples for business measures following an S-shaped function are adoption rates of new products, market shares of new companies, the effects of new processes or new organizational practices and the like.

    Providing a customizable (i.e. user-defined) S-shaped function in a Tableau workbook can be very helpful across all stages of advanced analytics: in descriptive and diagnostic analyses, the S-shaped function can be used as a customizable reference line for the actual historical development and for analyzing deviations. In predictive and prescriptive analytics, the S-shaped function can be used to model and forecast expected future developments and to perform sensitivity and what-if analyses.

    Having a ready to use S-shaped function in Tableau is a must-have for your Advanced Analytics Toolbox.

    Today’s post provides a Tableau workbook template with a fully flexible user-defined S-shaped function. The workbook is published on Tableau Public and also available for free download.

    (more…)