Options for displaying a Progress Indicator in Microsoft Excel during time consuming VBA procedures and a Speed Comparison of the different approaches
 If your Excel model includes time consuming VBA procedures or algorithms, you certainly want to update the users about the progress of the code. In principle, there are three different approaches: you can either update Excel’s Status Bar at the bottom left of the Excel window, use a dedicated cell range or an object (e.g. a chart) directly on the active worksheet and update the cells by VBA or simply display a VBA user form showing a progress bar.
Today’s article presents a selection of examples for each of these approaches, discusses their pros and cons and compares the techniques regarding the additional runtime to show the progress indicator. As always, the post comes with a link to the used Progress Indicators Speed Comparison Tool for free download.
VBA Progress Indicator Option 1 – The Status Bar
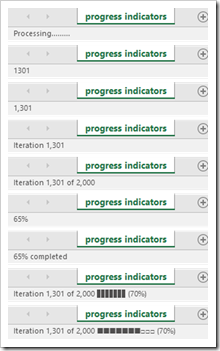 Displaying a progress indicator in the status bar (at bottom left of the Excel application window) is the easiest approach. All you need in your VBA code is a statement like:
Application.StatusBar = “Processing…”
and you will see the text “Processing…” in the status bar of your Excel window. At the end of your sub you simply reset the status bar using the following statement:
Application.StatusBar = False
You can use simple strings (like “Processing” or “Importing data” or “Step 1” or something else) or you display numbers like loop counters or percentages. Have a look at the screenshot at the left. Display the number of the current iteration or the current iteration and the total number of iterations or the percentage completed. Whatever is appropriate for your VBA sub and whatever you like most.
Care for something more fancy? You can even display a pseudo progress bar chart by repeating e.g. the character █ based on the progress of your VBA code (see the two status bars at the bottom of the screenshot).
The advantage: it is very easy to implement.
The disadvantage: the status bar is not really prominent and users may overlook the progress indicator.
VBA Progress Indicator Option 2 – The Worksheet
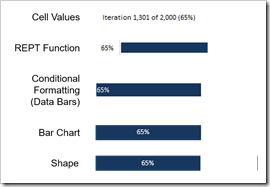 The second option is to show the progress directly on the active worksheet: a simple text, a pseudo bar chart using the REPT function, a percentage value with a Conditional Formatting Data Bar, a standard bar chart or a faked bar chart with a freeform shape (see screenshot left).
The advantage: you have more options where to display the progress information on your worksheet or dashboard and how it looks like (i.e. the formatting).
The disadvantage: you have to write data from VBA to the worksheet very often and this can be time-consuming (see here for more information: Excel VBA Read and Write Performance Test). In other words: a lot of overhead runtime will be added to the performance of your VBA code.
VBA Progress Indicator Option 3 – User Forms
 Last approach is the usual suspect and probably preferred by most Excel VBA developers:
Display a user form during the execution of your code: a small window without any buttons for interaction, automatically updated showing a progress bar and unloaded after the code is finished. In principle you have 2 options:
- Option 1: using labels on the user form, one for the total (100%), formatted with no fill color and one to display the progress bar with a fill color (e.g. a dark blue)
- Option 2: use the ActiveX control ProgressBar
The advantage: by default the user form will pop up in the center of the screen. There is no way the user will not take notice.
The disadvantage: creating the user form needs additional effort and it obscures parts of the worksheet. Most of the time the latter doesn’t matter, since you do not update the screen anyway during the execution of your code. However, there may be cases where you want your user to be able to see the whole worksheet during the execution of the code. I am not sure if you will need a progress indicator then at all, but still.
My Expectations
Even before I started to develop the speed comparison tool for the progress indicators described above, I had some expectations (or maybe gut feeling) of how the results would probably look like:
- The User Form indicators would be the fastest, because there is no interaction necessary between VBA and Excel
- The Status Bar approaches would be a bit slower, since they have to interact with Excel, but only with the application itself, not with the worksheet
- I didn’t expect big differences between the 9 different status bars. I only assumed that the ones displaying a simple number would be faster than the ones concatenating numbers and text
- The approaches updating cell ranges to display a progress indicator would definitely be the slowest, because writing data from VBA to the worksheet is costly in terms of performance
- Among the worksheet approaches, I expected the simple text in a cell to be the fastest and the bar chart and the faked bar (shape) to be the slowest
Well, it turned out that some my assumptions were correct, but there were also some surprises I didn’t expect.
Speed Comparison Test Results
Now, let’s have a look at the results of a speed comparison test for 1,000 iterations:
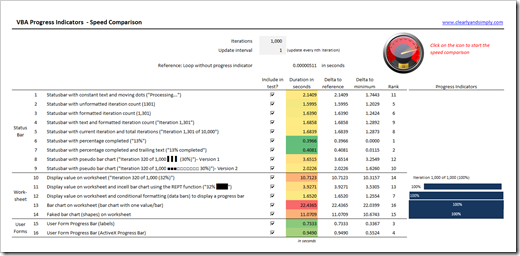 First, here are the results which fit to my expectations:
- Except for one, the worksheet methods are the slowest
- The User Forms are very fast
- Writing simple numbers to the Status Bar is – except for one – faster than writing a concatenation of text and numbers
But this is pretty much it with what I assumed. There are some surprising facts, too:
- The fastest approaches aren’t the User Forms: displaying percentages in the Status Bar is even faster.
- Showing a percentage in the Status Bar is considerably faster than displaying a number, even if you concatenate text to it
- Not all of the worksheet approaches are slow. Updating one cell and working with a Conditional Formatting Data Bar is actually a viable option
- Manipulating the size and text of a shape is almost as fast as simply writing a concatenated text to a cell
Just a few things I learned. Have a look for yourself and see what you can find.
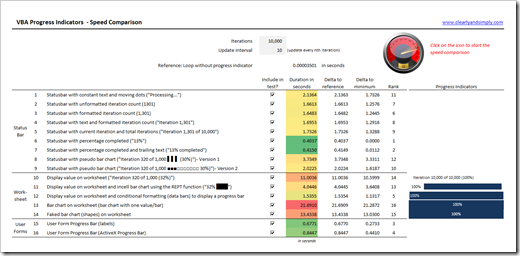
Now, let’s try a bigger number of iterations. Here are the results for 10,000 iterations and an update interval of 1 (i.e. update the progress indicator on every iteration). Here are the results:
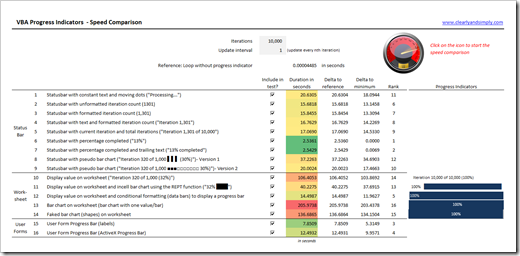 You can easily see that the ranking of the approaches is similar, but the absolute numbers are very high.Even with the fastest option, you would still add 2.5 extra seconds to the runtime. Thus, it is important to work with the update interval, i.e. only update the progress indicator every nth step. If we increase this interval to 10, we get down to overhead runtimes as we have seen in the 1,000 iterations example:
 Please note that all results will vary depending on hardware, software, environment, other application or background tasks running, etc.
My Conclusions
These are my main takeaways from the Progress Indicators Speed Comparison Test:
- I would still recommend a User Form for displaying a progress indicator. Not the fastest technique, but close. And – important in my humble opinion – the users will definitely take notice
- If you are working with the Status Bar, display percentages instead of numbers and texts (if appropriate)
- If you really want (or have) to display the progress on the worksheet, use a Conditional Formatting Data Bar
- Think twice and do some test runs before you select the update interval. You do not have to inform the user about every single iteration. Just update as often as necessary to keep your user informed about the progress
The Download Link
If you are interested in conducting your own progress indicator speed tests and / or in the VBA code producing the indicators shown above, you can download the test tool workbook for free:
Download Progress Indicators Speed Comparison
(zipped Microsoft Excel 2007-2016 workbook, 63K)
Please be advised that the code uses Windows functions (QueryPerformanceCounter and QueryPerformanceFrequency) to stop the time. Therefore the code will not work with Excel for Mac.
Stay tuned.
Leave a Reply