Why band charts should be used more often and how to create them with Microsoft Excel and Tableau Software
 Band chart, range chart, high-low line chart, corridor chart. I don’t know whether there is a standard term for this type of charts, so let me call it a band chart hereafter.
What is a band chart?
Basically a band chart is a standard line chart enhanced with a shaded area displaying the upper and lower boundaries of groups of data (e.g. the range between the minimum and the maximum of all members of the category). Band charts are very often supplemented by another line showing the arithmetic mean (the average).
What is the big whoop?
Band charts provide by far more context to your visualization and more insight into your data. Especially if you have to explore unknown data sets. They are easy to implement, very intuitive, very effective and do not require one pixel more of your dashboard real estate than a standard single line chart.
This being said, I have always been wondering why I do not see these charts more often in my professional environment. Are people underrating the benefits of band charts or am I overrating them?
Today’s article discusses the benefits and the use cases of band charts and provides tutorials of how-to implement this type of chart with Microsoft Excel and Tableau Software. As ever, including the Excel workbooks for free download and the Tableau visualization for direct access via Tableau Public.
The Benefits
Why is a band chart more efficient than a line chart? Because it provides more context. Unlike a single line chart displaying only the development of the selected data series over time, a band chart provides a variety of additional information at a glance. Let’s assume we are doing a competitive price analysis per product. Something like I did here: You can’t start a fire without a spark.
The line chart represents the development of the price of your selected product. Visualizing the competitive analysis as a band chart with an average line adds context and helps you to answer questions like
- How do minimum and maximum prices in the market develop over time? Are the prices going up or down?
- Is the spread of all product prices of all competitors staying stable, increasing or decreasing?
- How price competitive is your product? Are you closer to the minimum or to the maximum? Did this change over time? Did you become more or less price competitive?
- How close is your price to the average market price? How did this relationship change over time?
- Where is the average line compared to minimum and maximum? An average line close to the minimum is an indication that only a few competitors offer the product for a relatively high price.
Just a small selection of data analysis questions you can answer at a glance with a band chart.
The Use Cases
Here is a generic description of a data analysis challenge you may use a band chart for:
- The data includes a categorical dimension like regions, sales persons, companies, products, etc. and a numerical measure over time like monthly sales, revenues, profits, etc.
- The purpose of the visualization is not a comprehensive reporting of all values for all members of the category, but rather one report per member or an analysis tool for interactively exploring the data
Here are just a few real life business examples you could use band charts for:
- Sales performance of outlets or regions
- Revenues per sales region
- Your product prices compared to similar products of your competitors
- Profit and loss of companies or profit centers
The Example Data
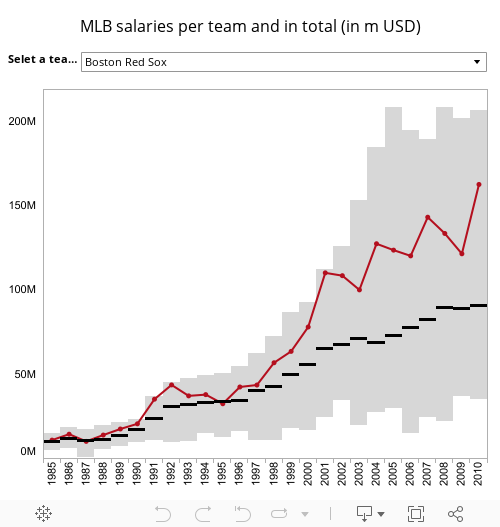
The data used in the Excel and Tableau workbooks below is taken from Sean Lahman’s Website. Sean is kind enough to provide “The Baseball Archive” for free download, a “free relational database of individual and team statistics that covers the game back to 1871”. I have taken only a very small fraction of data from the Lahman Baseball Archive: the salaries paid by the MLB teams from 1985 to 2010.
How to create a Band Chart with Microsoft Excel
As usual, there is more than one way to skin the cat:
1. Combination of a Line and a Stacked Area Chart
- Consolidate and prepare your data: calculate the selected data series, the minimum, the maximum and the spread, i.e. maximum minus minimum
- Create a line chart and add four data series to it: the selected series, the averages, the minimum and the spread between maximum and minimum
- Change the chart type of the minimum and the spread series to a stacked area chart
- Format the minimum series to be invisible (no fill color, no border)
- Format all other series the way you want
- Add a legend to explain the meaning of the data series
That’s it. Here is an example how this could look like:
 - click to enlarge") 2. A Standard Line Chart Line with High Low Lines
2. A Standard Line Chart Line with High Low Lines
- Prepare your data (see above)
- Create a line chart and add the selected series, the averages, the minimum and the maximum
- Add high-low-lines to the chart and format them the way you want
With this approach the band is less intense, but you still get the picture:
 - click to enlarge") 3. A Standard Line Chart Line with very thick High Low Lines
3. A Standard Line Chart Line with very thick High Low Lines
Excel 2007/2010 enables you to change the width of the high-low-lines. Setting the width to e.g. 30 pt. and formatting the maximum and minimum line with no line creates shaded reference bands like this:
 - click to enlarge")
Instead of high-low-lines, you can also use error bars or additional data series in an XY scatter chart. Jon Peltier has a great article on all the aspects of High-Low Line Alternatives in Excel Charts.
Here is my Microsoft Excel workbook including the three examples described above for free download:
Download Band Charts / MLB Salaries (Microsoft Excel 2003, 217K)
How to create a Band Chart with Tableau Software
Tableau Software has no built-in area chart type. Workarounds are possible by preprocessing the data, defining custom SQL data connections or using polygons.
For creating a band chart, however, we do not need one of those workarounds. Tableau’s built-in reference lines combined with a little trick of replacing the built-in filter by a Parameter and a Calculated Field will do the job.
Here is the step-by-step tutorial:
- Create a Parameter based on the list of teams
- Create a Calculated Field assigning the salaries if the selected Parameter is equal to the team, otherwise Null
- Drag the year to the column shelf and the calculated field to the row shelf
- Drag [Salaries] and [Team] to the level of detail shelf
- Right click on the horizontal axis and add a reference line, select per cell for the scope and average of [Salaries] as the line
- Add another reference line, select “Band”, choose per cell as the scope and define the band from minimum of [Salaries] to maximum of [Salaries]
- Finally do the formatting the way you like
That’s it.
Here is the visualization on Tableau Public:
The Power of Band Charts
I confess, I do not know anything about Baseball. Of course “I don’t memorize who played third base for … Pittsburgh in … 1960” (remember the film?). I do not even know the names of all the teams and I have no clue how much a MLB team costs. However, the band chart helped me to understand at least the following facts within a couple of minutes:
- The New York Yankees are the all time big spenders. Their salaries have been the highest until 1988 and again every season since 1996 until today. Even in the 1990s the Yankee’s salaries have always been way above the league’s average.
- The Houston Astros seem to be the average Joe in terms of salaries. Except for 1991/92 and 2009, their salaries are closely dancing around the leagues average line.
- The Montreal Expos have been the scrimpers. No team has been as close to the minimum line of the salary band as they were.
I bet most of you know this and I guess I am stating the obvious here. But the topic and the data were completely new to me and it took me only one very simple interactive chart and a few mouse clicks to get some meaningful insights.
So, next time you have to explore an unknown data set, I highly recommend giving the band chart a try.
Your thoughts?
As I mentioned in the introduction, from my point of view the band chart is totally underrated. In my professional environment I have barely seen these charts, Actually I think in my small world, I am one of the few using them at all.
What do you think? Is it just a coincidence that people I am working with are not using this chart type? Or am I overrating its importance? Please leave me a comment and let me know what you think about band charts.
Acknowledgement
Many thanks go to Dan L for all the discussions we had on band charts, for pointing me to the Baseball example data and in general for providing me with the idea to this post. Thanks, Dan!
Many thanks go also to Sean Lahman for compiling and sharing his great Baseball Archive. Thanks, Sean!
I am having some more things in my pipeline on data analysis, visualization and optimization with Microsoft Excel and Tableau. More to come soon.
Stay tuned.
Leave a Reply