Category: Visualization

  • All Peaks of the Alps visualized with Tableau

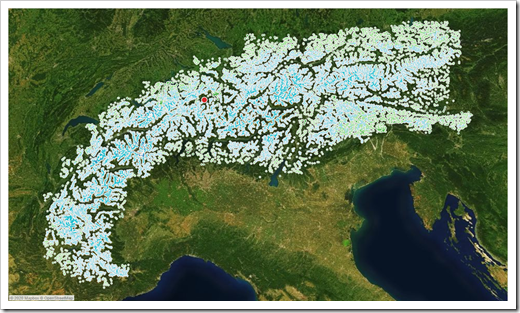
    A Tableau visualization of all peaks of the alps including the option to find and highlight one peak or to select one by clicking on the map

    The FrankensTeam runs one of the most interesting and resourceful websites about advanced charting techniques in Microsoft Excel (E90E50fx). In March 2015 the team met in person for the very first time in Milan. To celebrate this, they published an Excel workbook with a visualization of all peaks of the Alps: Meeting in Milano, trip to the Alps and an Excel chart

    All Peaks of the Alps in Tableau PublicHaving been a mountaineer in my younger days, I was intrigued with this idea. I asked them for permission to use the idea and data for a replica of their visualization in Tableau. They kindly agreed.

    I am deeply ashamed to admit that I am sitting on the Tableau replica for a couple of years already, but never published it. Until today.

    This post provides and explains a Tableau Public workbook showing all peaks of the alps with all the amazing interactive features of Tableau.

    (more…)

  • Optimized Choropleth Maps in Microsoft Excel

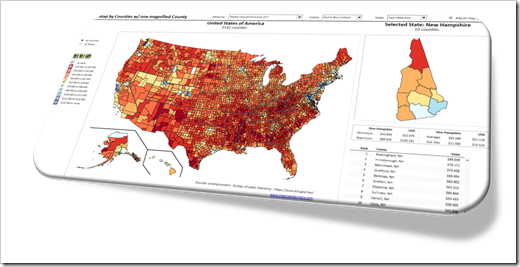
    How to create optimized Choropleth Maps in Excel with a higher resolution and without distortions using Excel 365

    Inspired by an idea of my internet friend and highly esteemed colleague Leonid Koyfman, the post US Choropleth Map by County per State – a 4th Option described and provided an Excel workbook with a Choropleth Map of the United States including a second map showing a magnified view of one selected state.

    Optimized Chroropleth Maps in Excel (Intro)The code and technique itself worked fine.

    However, there was one major disadvantage: during the process of creating the map in Excel, the shapes were slightly distorted. The zoomed map of one state still looked good for e.g. Texas or California, but definitely not for smaller states like Rhode Island or Connecticut.

    Today’s post provides a solution to overcome this issue: a way to create a Choropleth Map in Excel without distortions, displaying all counties accurately, no matter at which zoom level. As always, an example workbook is provided for free download.

    (more…)

  • Dynamic Icons in Microsoft Excel Cell Ranges

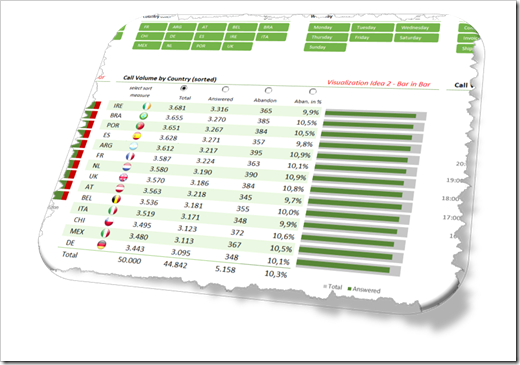
    Spice up your interactive Excel Dashboards with dynamically changing Icons, Pictures or Charts

    The Excel workbooks which came with two of my recently published posts showed dynamically changing flag icons inside of a dynamic table on an Excel dashboard.

    Showcase for Table Slicers on Excel Dashboards

    My 2 Cents on the COVID-19 Dashboard by JHU.

    Dynamic Icons Excel Ranges Intro

    The tables visualized data per country and the flag icons next to the country names were automatically adjusted if the user filtered the data, changed the sort criterion or scrolled within the table.

    This week I received some feedback on these workbooks and readers asked, if I could explain this in more detail. No sweat: todays post provides a step-by-step explanation of the technique and the according workbooks for free download.

    (more…)

  • My 2 Cents on the COVID-19 Dashboard by JHU

    For what it’s worth: a few remarks on the currently extremely popular COVID-19 Dashboard provided by the Center for Systems Science and Engineering (CSSE) at Johns Hopkins University (JHU)

    When the Corona pandemic started, I was tempted to build and publish a dashboard about the spread of COVID-19, too. But then I decided not to. Not only because much brighter people than me beat me to it, but also because the topic is very sensitive. People suffer and people die. Not the type of data I want to analyze and visualize. Hence, I stayed out, stayed home and wrote a few articles about something else (see my recent posts).

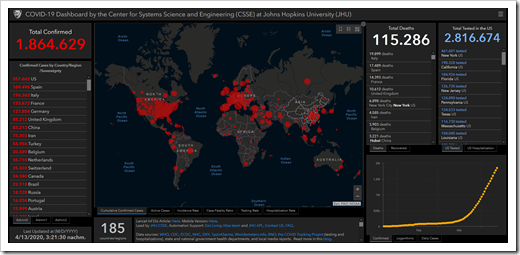
    Today I changed my mind. I still don’t want to create a comprehensive COVID-19 dashboard, but I would like to add my 2 cents to the definitely most popular Corona Data Visualization: the COVID-19 Dashboard provided by the Johns Hopkins University:

    COVID-19 Dashboard JHUThis afternoon, I read that this dashboard is currently clicked 1.2 billion (!) times a day.

    First things first: it is a great dashboard providing the most important numbers at a glance and various options to drill down into the details. I am very impressed by its features, how quickly this visualization was made available and how often the underlying data is updated. My congratulations to the data science team of the JHU.

    Having said that, I also see a few weaknesses and today’s post will discuss two of them.

    (more…)

  • Choropleth Maps of Italy in Excel

    A Collection of Choropleth or Filled Maps of Italy in Microsoft Excel

    Map and Flag of ItalyHeads-up: today’s post is dedicated to my friends and readers in Italy. You will certainly only be interested in this article, if you are working in Italy and/or with Italian data.

    If not, you can easily skip today’s post. It does not include any new ideas, it is only new wine in old wineskins: a collection of Choropleth Map techniques (already published here), applied to maps of Italy for different levels of detail.

    ClearlyandSimply is a special interest blog with only very few readers. Most of them are located in the United States, but when I am looking at the web traffic coming from Europe, Italy is always ranked among the top 3, way ahead of e.g. France or Spain.

    I do not exactly know why. I have a hunch, though:

    Back in 2014 and 2015, I helped my friend Marco Nicolucci creating Tableau visualizations of the history of the Serie A (Italian football, or calcio as you say) and the Rugby World Cup for La Gazetta dello Sport. As of today, both visualizations are still available on the Datamania site of La Gazetta:

    If the visualizations should no longer be available on La Gazetta dello Sport, you can also find copies on my Tableau Public Profile.

    So, maybe the publications on La Gazetta dello Sport drove some traffic from Italy my way.

    Also, maybe my Italian internet friend and highly esteemed colleague Roberto Mensa spread the word about my blog. You probably know Roberto. If not, you definitely missed something. Roberto is the guru for data visualization with Microsoft Excel, not only in Italy, but throughout Europe. Together with Krisztina Szabó and Gábor Madács from Hungary, he is running a website called E90E50. I highly recommend to check out the E90E50charts – Excel Charts Gallery, you will find truly amazing work there, all for free download.

    Well, wherever the traffic comes from, this post is for my Italian readers:

    A collection of 6 templates for creating Choropleth Maps of Italy in Microsoft Excel. All of them are ready to use. Simply download the workbook(s) you like, replace the dummies by your own data and you are good to go.

    (more…)