Category: Tableau

  • Word Clouds with Tableau

    How to create Word Clouds with Tableau and a look at the value of Word Clouds for serious Business Data Analysis

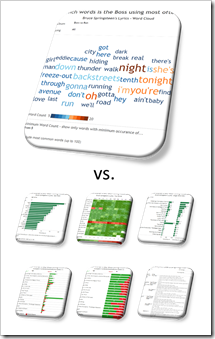
    Word Clouds vs AlternativesThe previous two posts (Word Clouds with Microsoft Excel and The Implementation of Word Clouds with Excel) provided and explained my VBA-based solution to create dynamic Word Clouds (aka Tag Clouds) in Microsoft Excel.

    Unlike Excel, Tableau provides a native feature to create Word Clouds with a few mouse clicks. The feature is available since Tableau version 8, but not everybody is aware of this, because Word Clouds aren’t displayed if you click the Show Me button (Tableau’s “chart gallery”).

    That’s why I want to complete my short series on Word Clouds with a step-by-step description of how to create this type of view in Tableau and two tips to make Word Clouds more effective.

    However, I am up to something more: Word Clouds are a nice little visualization and come in handy if you want to draw someone’s attention to your presentation or infographic. Having said that, they are more or less useless if you need your data to answer your questions or tell your story. The second part of today’s post will try to prove that there are much better visualizations for serious data analysis than a Word Cloud.

    (more…)

  • La Gazzetta dello Sport gives Tableau a try

    La Gazzetta dello Sport, the famous Italian sports newspaper uses Tableau Software to visualize 20 years of Italy’s Serie A
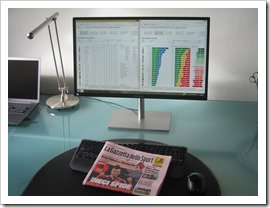
    La Gazzetta dello Sport and Tableau SoftwareIn spring this year, I received an email from Marco Nicolucci. Marco stumbled across my Tableau workbook visualizing the history of the English Premier League:

    England Premier Football League – Historical Statistics

    This workbook already got some exposure from Tableau: it is part of the Tableau Public Gallery, it was mentioned in the wrap-up to the first Tableau Sports Viz Contests (Other Winners from the Sports Viz Contest) and it even made the cut for the 25 of the best Tableau Public Vizzes.

    Marco apparently liked my dashboards, too. He asked me, if I could support him to rebuild the Tableau workbook for Italy’s Serie A. So far nothing unusual. From time to time readers contact me with some questions and requests. However, this email was something special and really exciting, because Marco is a sports journalist at La Gazzetta dello Sport, Italy’s famous and prestigious daily sports newspaper.

    La Gazzetta dello SportFor those of you who do not know La Gazzetta: La Gazzetta dello Sport is not only the Italian sports newspaper with the widest circulation (ca. 450,000 per day on average with a readership in excess of 3 million), but also one of the eldest sports newspapers in the world, first published in 1896. La Gazzetta online according to Alexa is ranked 843 worldwide and 21 in Italy. They have 1.13 million followers on Twitter and 1.5 million likes on Facebook. In Italy, La Gazzetta is more than a newspaper. It’s an institution.

    It goes without saying that I was thrilled and honored being asked to become part of this project. In the next few weeks, Marco and I used my Premier League Workbook as a basis and built a comprehensive Tableau workbook to analyze and visualize the last 20 years of Serie A:

    • 2 storyboards, 9 dashboards, 32 views
    • the classical visualizations like tables, fixtures, goal differences, win-draw-loss chart, etc.
    • additional visualizations like a results cross table for one entire season, an all time table (all time = 20 years), a view for one selected team, a comparison of 2 selected teams and a simulation of the 3 points rule versus the old 2 points rule
    • various options to slice and dice the visualizations, like home and away table, sorting options, include or exclude points deductions, etc.

    Our workbook was published on La Gazzetta online last Tuesday (August 26, 2014):

    Serie A, l'era dei 3 punti

    It is worlds apart from my original Premier League viz and provides many more options and dashboards. Thus, I thought the Tableau users and football fans among you may be interested in having a look. The dashboards are in Italian, of course, but I think you can easily figure out how it works and what is shown.

    So far, the visualization received almost 60,000 views. To put this into context: my Premier League workbook had a little bit more than 31,000 views in three years(!).

    Special thanks go to Marco Nicolucci for making me part of this great project. I am proud and honored. Not only that I had a lot of fun during our collaboration, I am feeling I made a new friend. Thank you, Marco!

    Stay tuned.
  • Tableau’s Viz as Art Contest – My Entries

    A sneak preview of my entries for Tableau’s “Viz as Art” Contest

    Tableau Management Dice Art PortraitsIt is visualization contest time again over at Tableau Software. This time it is a “Vis as Art” contest.
    I have published a couple of Tableau workbooks visualizing art here on Clearly and Simply in the last few years:

    Tableau Replica of Curtis Steiner’s 1,000 Blocks

    6 Famous Paintings in Tableau

    Dice Portraits of the Tableau Management

    Since I had a little selection to pick from without much extra work, I decided to take part in the contest this time and I submitted three entries: one as it is (replica of Curtis Steiner’s 1,000 blocks), a revised and enhanced one (Tableau Management Dice Portraits) and a new one (La Linea goes Tableau).

    I have seen the great quality of the shortlisted entries and the winners of former contests. Therefore I am not pitching my hopes too high, one of my visualizations could make the cut for the 10 best entries which will be published on the Tableau Public Blog. Hence, I thought I’d share my entries with you here.

    (more…)

  • String Calculations in Tableau

    Concatenation, Conversion, Analysis and Extraction –
    44 Formulas to work with Strings in Tableau’s Calculated Fields

    NY Mag Crossword - Photograper: Lori L. Stalteri (flickr.com)“String Calculations” is a somehow weird expression. Calculations on texts sounds like a contradiction in terms.

    Of course you do not really calculate strings. You manipulate and analyze them like concatenating texts, changing texts (e.g. to upper, lower or proper case), converting texts or parts of texts to numbers or dates, extracting parts or analyzing them (e.g. how many words or do they contain a number), etc.

    If you do not have the option to do this type of things directly in your database, you will use Calculated Fields in Tableau Software to get what you want from the text dimensions in your data source. That’s why I called this post String Calculations in Tableau.

    Today’s post contains a set of 44 more or less practical examples of concatenation, conversion, analysis and extraction of texts. I will not go into the basic string functions of Tableau, like LEFT, FIND, LEN, REPLACE, etc. You can easily look up how they work in the manual or read the explanations directly in the Calculated Field editor.

    I rather tried to pull together a small library of 44 more complex formulas you may find useful when you have to work with strings in Tableau, like concatenate strings and a date, convert a string to a date, reverse words in a string, extract parts of a string, remove line feeds, check if a string contains a number, count the number of words in a string and many more.

    The article lists and explains all 44 formulas. I do not delude myself into believing anyone would read today’s article from start to finish. It is more a reference type of post and this is on purpose.

    However, I recommend having a brief look inside, even if you are not looking for a certain string calculation in Tableau at the moment. I am starting the article with a little text visualization example and I am also providing a Tableau packaged workbook (on Tableau Public ) including all examples for free download at the end of the post.

    (more…)

  • 99 Blog Posts and 1000 Comments

    A Celebration Post: Looking back at 99 Blog Posts and 1,000 Comments since this Blog started

    100 fotos de My Buffo - Photographer: Julio César Cerletti García (flickr.com)This will be an unusual post.

    Not only that we had 99 articles since this blog started, we also received the 1,000th comment recently. I am talking about reader comments only, i.e. my replies are not included in this number. A perfect coincidence for a celebration post, isn’t it?

    So, no Excel or Tableau tips and techniques today.

    Wait! Where are you headed? Hang on.

    Be assured that today’s post will not be a simple self-adulation. Well, at least not only. It will – of course – provide some hopefully interesting data analyses and data visualizations, too.

    Now, starting point was the question what to analyze and visualize in this celebration post. My first idea was showing some web analytics dashboards. However, I decided to refrain from that because those numbers are embarrassingly low. Instead, today’s dashboards will focus on the content of this blog: both the articles and the comments. And while we’re on it, we will also have a look on my performance: again regarding the posts and the comments.

    So please have a look inside. The visualizations are a mixture of “sitemap-like” views (allowing to browse and access all content and comments) and some performance analytics. The dashboards are provided online via Tableau Public, so you you can explore them directly here in your browser, even if you don’t have Tableau installed.

    (more…)