Call out positions of selected data points in your Tableau view using Drop Lines
I am barely
using gridlines on my charts. In fact I didn’t even know that Tableau Software has an option to show and format gridlines. Hence I
started the original introduction to this post as follows:
Unlike Microsoft
Excel, Tableau Software does not provide an option to display gridlines on
charts. Tableau allows you to define so called row and column dividers, but
only for categorical data, i.e. dimensions.
This statement
is totally wrong: Tableau offers gridlines (Format | Lines | Grid Lines) and
Rich was kind enough to correct this in the first comment to this post. Thanks
Rich. My fault. I apologize for the confusion.
But still:
gridlines are very often nothing else than chart junk as Stephen Few points out
in this excellent article: Grid Lines in Graphs are Rarely
Useful. Tableau has something way
more useful than gridlines: the interactive Drop Line.
Today’s short Tableau Quick Tip #4 introduces this extremely helpful interactive feature of Tableau.

 Dragging and dropping fields to the different shelves is the heart of user interaction in Tableau Software. In general, Tableau is predominantly designed for using the mouse.
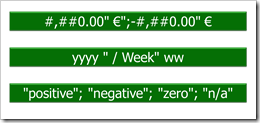
 Tableau provides a variety of built-in number and date formats. There are the standard formats “numbers”, “currency”, “scientific” and “percentage”. For scientific and percentage you can only change the decimal places, but for numbers and currencies you can also define the way negative values are displayed, the displayed units, the thousand separator and you can add a prefix and/or suffix to the number. For date fields, Tableau offers 17 different standard formats.
 I decided to start a new little category of posts here on