Category: Microsoft Excel

  • Interactive Bullet Graphs in Excel

    An interactive Multiple Row Bullet Graph in Excel displaying the gap and data labels only when hovering over a bar with the mouse

    The previous post presented An Alternative Design of Bullet Graphs in different versions and provided the implementation in a Microsoft Excel template workbook for free download.

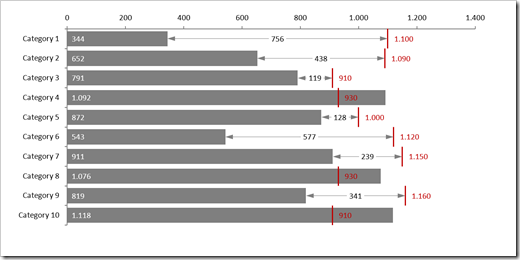
    Long time Clearly and Simply readers and contributors Matt Grams (check out Matt’s guest post: Bullet Graphs for Excel: A Simple Way?) and Leonid Koyfman (Leonid’s LinkedIn Profile) liked the alternative design in general, but also came up with a justified and constructive criticism regarding the Multiple Row Bullet Graph:

    Multiple Row Bullet Graph - click to enlargeThey noted that

    • the chart is too busy and a bit overloaded, especially if you are using it in a relatively small size, e.g. on a dashboard with other views
    • in certain edge cases, the data labels may overlap and become unreadable

    Valid points. I fully agree with Matt and Leonid.

    To make the chart less busy and more readable, Leonid suggested to turn it into an interactive Bullet Graph which displays the span of the gap (the thin line with arrows between actual bar and target line) and the data labels for gap and target only, if the user hovers over the bar with the mouse:
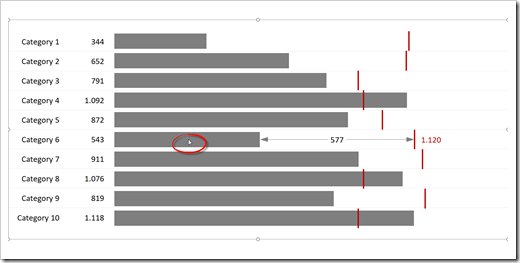
    Interactive Bullet Graph - click to enlargePlease note the mouse cursor over the bar of Category 6.

    The underlying technique and VBA code is described here: Mouse Driven Actions on Excel Dashboards.

    This interactive version definitely looks much cleaner, but it also comes with a few disadvantages:

    • The user has to activate the chart (click on the chart area) first to make the mouse hover action available
    • The approach is not applicable for dashboards delivered in a static version like PDF or printed. It only makes sense, if the user directly interacts with the chart in Excel
    • Unlike the original version, this solution requires VBA code
    • Because of the VBA code, it takes more time to transfer the template from the example workbook to your own model. You can’t simply drag the sheet over to your file, you also have to copy the entire code from all objects, modules and class modules
    • It requires Microsoft Excel 2013 or later

    Anyway, it still is a viable and interesting alternative to the original version.

    Here is the Excel 2013/2016 workbook for free download:

    Download Interactive Bullet Chart (zipped Microsoft Excel 2013-2016 workbook, 32K)

    Many thanks to Matt and Leonid for the feedback and suggestions. Much appreciated.

    Stay tuned.
  • An Alternative Design of Bullet Graphs

    An alternative design of Bullet Graphs: no qualitative ranges, additional data labels and a visualization of the performance gap (if applicable)

    Bullet Graph Alternative DesignMore than 10 years ago, Stephen Few of Perceptual Edge introduced the Bullet Graph: an alternative chart type to replace the formerly (and unfortunately sometimes still) popular gauges and speedometers on dashboards. A Bullet Graph visualizes a performance metric compared to a target (or other comparative measures) in a small, clear, simple and effective view. In the meantime, the Bullet Graph has become a widely respected, even standard chart type. Some major Data Visualization software applications like Tableau Software natively support Bullet Graphs.
    Back in 2009, Matt Grams described a possible solution of creating Bullet Graphs in Excel here on Clearly and Simply: Bullet Graphs for Excel: A Simple Way?

    I am using Bullet Graphs very often in my models for a very long time already, especially on Performance Measurement Reports and Dashboards. Starting with Stephen’s original design specification, I received a lot of feedback from my clients over the years. As a consequence, I made a few variations to the design of the Bullet Graph regarding the qualitative ranges, data labels and the performance gap (if applicable, i.e. if actual is smaller than target).

    Today’s article describes my variations of the original Bullet Graph design, explains the background why I made them, shows how to implement the charts in Microsoft Excel and provides the corresponding Excel workbook for free download.

    (more…)

  • Microsoft Excel VBA Progress Indicators

    Options for displaying a Progress Indicator in Microsoft Excel during time consuming VBA procedures and a Speed Comparison of the different approaches

    Progress / Photographer: David Ingram (flickr.com)If your Excel model includes time consuming VBA procedures or algorithms, you certainly want to update the users about the progress of the code. In principle, there are three different approaches: you can either update Excel’s Status Bar at the bottom left of the Excel window, use a dedicated cell range or an object (e.g. a chart) directly on the active worksheet and update the cells by VBA or simply display a VBA user form showing a progress bar.

    Today’s article presents a selection of examples for each of these approaches, discusses their pros and cons and compares the techniques regarding the additional runtime to show the progress indicator. As always, the post comes with a link to the used Progress Indicators Speed Comparison Tool for free download.

    (more…)

  • Excel VBA Read and Write Performance Test

    What is the fastest way to read values from and write values to an Excel worksheet with VBA? And how much faster is it?

    Stop Watch / Photographer: Leo Reynolds (flickr.com)The most common and most effective recommendations to speed up slowly running VBA code in Excel are the following four:

    1. Turn off the screen updating while the code is running

    2. Set Excel’s calculation mode to manual while the code is running

    3. Don’t select (activate) objects (ranges, charts, shapes, etc.)

    4. Optimize the way of reading values from and writing values to the worksheet. Instead of looping through a range, read or write the entire block of data in one go with one single statement.

    Well, you have seen those before, right? Nothing new under the sun.

    However, how much can you speed up your code with these best practices?

    Well, for the screen updating and the calculation mode, it depends on how your specific workbook looks like. The more complex the display is (i.e. how much rendering Excel has to do to update the screen?) and the more and more complicated formulas you have in your workbook (i.e. how long does one recalculation take?), the higher the performance gain will be. Thus, it is hard to provide universally valid numbers on the potential performance increase.

    With regards to the avoidance of Select statements and the method of transferring data between Excel and VBA, however, a more or less generic test environment is possible.

    Today’s post provides a small Performance Test Tool to demonstrate how much faster your VBA code can be, if you are using the best method to read data from or write data to an Excel worksheet using VBA. As always, the article comes with the Excel workbook for free download.

    (more…)

  • Mouse Driven Actions on Excel Dashboards

    Add context and interactivity to your Excel Dashboards with mouse hovering and clicking actions

    Mouse driven Action Dashboard in ExcelThe previous posts Customizable Tooltips on Excel Charts and User-defined Excel Chart Tooltips showed how to provide insightful tooltips when hovering over a data point on an Excel chart.

    The idea and its implementation can be taken one step further: instead of displaying a tooltip, hovering over or clicking on a data point of an Excel chart can send this information across your dashboard to other views (charts or cell ranges). I.e. you can select one data point out of many in one view and display detailed information on this selected data point in other views.

    My other favorite data analysis and data visualization application, Tableau Software, calls this an action. This is a fantastic feature for data exploration and analysis, especially for larger data sets.

    Today’s post shows how to mimic Tableau’s mouse hovering or mouse selecting actions on an Excel dashboard. As always, the Excel workbook is provided for free download.

    (more…)