Category: Microsoft Excel

  • The Implementation of Word Clouds with Excel

    Approach, algorithm, VBA code and performance optimization of the Word Cloud with Excel implementation

    Word Cloud - VBA CodeThe previous post Word Clouds with Microsoft Excel introduced another workaround to create a word or tag cloud in a standalone Microsoft Excel workbook.

    The article briefly describes the approach, the user-defined settings, the result and the drawbacks of the workaround. It also provides 3 different versions of the workbook for free download.

    Today’s follow-up article will have a closer look into the machine room: some more details on the approach, the data structure, the algorithm, the implementation in VBA and a dirty little trick to optimize the performance of the code for inserting and formatting freeform shapes on a worksheet using VBA.

    As a little bonus, today’s post also includes a tiny Excel tool to easily split continuous texts into a list of words and their count, i.e. the data structure needed for the word cloud workaround. Of course the tool is provided for free download.

    (more…)

  • Word Clouds with Microsoft Excel

    Create dynamic Word Clouds / Tag Clouds in Microsoft Excel

    Word Clouds in ExcelUnlike Tableau Software, Microsoft Excel provides no native feature to create a word cloud (aka tag cloud), i.e. a visual representation of text data where the font size of a word depicts the frequency of this word in a text.

    Workarounds for creating word clouds in Microsoft Excel are available for free, some of them for almost 10 years already.

    I also made my contribution with the article Wordle Tag Clouds in Microsoft Excel in 2010. All of the workarounds come with some considerable limitations and mine is probably the worst: it requires an Internet connection, needs another click in the webbrowser control and – worst of all – it doesn’t work anymore with Excel 2013, because Microsoft disabled scriptable ActiveX controls on worksheets in Office 2013.

    I am fully aware of the fact that word clouds are a very poor tool for data analysis and business data visualizations. However, they definitely have their place in infographics. Moreover, realizing a word cloud in Excel is an interesting VBA challenge.

    Hence, I decided to create another workaround for word clouds in Microsoft Excel.

    Today’s article introduces my new implementation of word clouds in Excel including the workbook(s) for free download. I will go into the details of my approach in a follow-up post.

    (more…)

  • Microsoft Excel Check List Compilation

    A compilation of variations and enhancements of the interactive Microsoft Excel Check List Template

    Checklist - Photographer: adesigna (flickr.com)Clearly and Simply is supposed to be a blog on data visualization and data analysis. Hence, it is a bit embarrassing to admit that the most popular blog post ever is totally off topic. Believe it or not, it is the Microsoft Excel Check List Template published in August 2012.

    Most hits on any given day, second most comments (176 so far), most downloads.

    This is probably the case because I somehow managed to be shown on Google’s first page if you search for “Excel Checklist” or “Checklist Template”. Very popular searches, I guess.

    Anyway. People seem to like this interactive check list and asked for various modifications and enhancements of the template. I already posted a few variations, but since they are buried in the avalanche of comments on the original post, I thought a compilation of the frequently asked enhancements could be helpful.

    Today’s post provides the original check list and 14 of the most interesting modifications and enhancements: time and user stamped check lists, more checkboxes per item, check list with 3 possible states of an item and some more.

    As always, the Excel workbooks including the unprotected VBA code are provided for free download.

    (more…)

  • SQL Saturday BA Edition 2014 in London

    The slides and workbooks of my presentation on “Charts beyond Excel’s Chart Wizard” at SQL Saturday in London 2014

    SQL Saturday BA Edition 2014 in LondonLast Saturday (November 22, 2014), I had the privilege to give a little presentation about charts beyond Excel’s default chart gallery at SQL Saturday BA Edition in London.

    For everyone who attended the session and anyone else interested, here is a zipped folder containing the PowerPoint slides and Excel workbooks I used in my presentation:

    Download SQL Saturday 353 Charts beyond Excels Chart Wizard.zip (6.1 MB)

    Please be advised that there is one workbook missing in this folder: I showed a sneak preview of a Word Cloud realized in Microsoft Excel (see slide 10 of the PowerPoint presentation). I will publish this workbook in a separate blog post within the next few weeks.

    Many thanks to Jen Stirrup for organizing the event and inviting me, to Bob Phillips for suggesting me as a speaker, to Roger Govier for his encouraging words and of course to everyone who took the time to attend my session.

    If you have any feedback or questions, please feel free to leave me a comment here or contact me by email.

  • Gapminder Replica in Microsoft Excel

    A Gapminder-lookalike animated chart in Microsoft Excel, based on the generic Motion Chart Excel Template

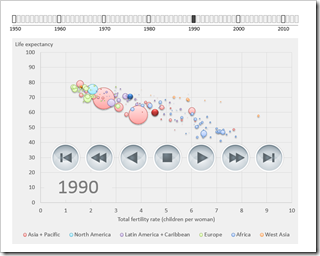
    Gapminder Replica in Microsoft Excel

    The recent article Motion Chart Excel Template provided a generic template for a motion or animation chart in Microsoft Excel. The examples in that post visualized episodes of the Italian cartoon series La Linea (La Linea article on Wikipedia).

    Today’s article will put the motion chart template to a more serious, business like use: a Gapminder replica in Microsoft Excel.

    For those of you who do not know Gapminder: Gapminder is a data visualization software to animate statistics. It was originally developed by Prof. Hans Rosling and his team and Prof. Rosling presented it in this famous TED talk:

    Hans Rosling shows the best stats you have ever seen

    Today’s article rebuilds this data visualization and animation in Microsoft Excel using exactly the same metrics. As always, the Microsoft Excel workbook is provided for free download.

    (more…)