Category: Charts

  • Cartograms in Tableau

    Plotting preprocessed polygon data as Cartograms in Tableau: the results of the US Presidential Elections since 1900
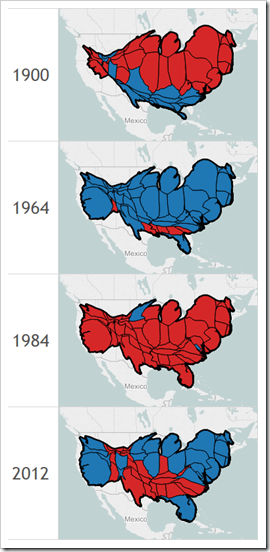
    Cartograms of the US Presidential Elections plotted in TableauChoropleth Maps or Filled Maps (as they are called in Tableau) are a great technique for analyzing geographical data, especially for maps with a high level of detail (e.g. US by counties or ZIP codes). They make it very easy to identify geographical hot spots first and then drill down into these regions using other visualization types.

    Having said that, they also have their limitations and disadvantages. Even worse, under certain circumstances Choropleth Maps can be misleading and visualize the data incorrectly.

    A classic example of misleading Choropleth Maps are the well known US Presidential Election Maps. We all have seen them, right? A map of the USA with color coded states: a red fill color if the Republican candidate won the state and a blue fill color if the Democratic candidate won (and in some years other colors for independent candidates).

    Although these maps correctly depict the geographical distribution of “who won where”, they are usually telling the wrong overall story.

    How come?

    Traditionally Republicans very often win some of the larger states with a small population density like Alaska, Montana and Wyoming (and thereby only a small number of electoral votes). As a consequence red often dominates the color coding of the map, even if the Democratic candidate won the entire election.

    Cartograms are a geographical visualization on a map avoiding this problem. Cartograms are distorting the map by resizing its regions according to e.g. the population, the popular votes or the electoral votes, At the same time the Cartogram algorithm tries to retain the topology of the map as far as possible.

    Today’s article presents a dashboard on Tableau Public comparing a Filled Map with a Cartogram for every US Presidential Election since 1900.
    (more…)

  • Word Clouds with Tableau

    How to create Word Clouds with Tableau and a look at the value of Word Clouds for serious Business Data Analysis

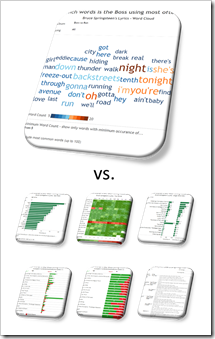
    Word Clouds vs AlternativesThe previous two posts (Word Clouds with Microsoft Excel and The Implementation of Word Clouds with Excel) provided and explained my VBA-based solution to create dynamic Word Clouds (aka Tag Clouds) in Microsoft Excel.

    Unlike Excel, Tableau provides a native feature to create Word Clouds with a few mouse clicks. The feature is available since Tableau version 8, but not everybody is aware of this, because Word Clouds aren’t displayed if you click the Show Me button (Tableau’s “chart gallery”).

    That’s why I want to complete my short series on Word Clouds with a step-by-step description of how to create this type of view in Tableau and two tips to make Word Clouds more effective.

    However, I am up to something more: Word Clouds are a nice little visualization and come in handy if you want to draw someone’s attention to your presentation or infographic. Having said that, they are more or less useless if you need your data to answer your questions or tell your story. The second part of today’s post will try to prove that there are much better visualizations for serious data analysis than a Word Cloud.

    (more…)

  • The Implementation of Word Clouds with Excel

    Approach, algorithm, VBA code and performance optimization of the Word Cloud with Excel implementation

    Word Cloud - VBA CodeThe previous post Word Clouds with Microsoft Excel introduced another workaround to create a word or tag cloud in a standalone Microsoft Excel workbook.

    The article briefly describes the approach, the user-defined settings, the result and the drawbacks of the workaround. It also provides 3 different versions of the workbook for free download.

    Today’s follow-up article will have a closer look into the machine room: some more details on the approach, the data structure, the algorithm, the implementation in VBA and a dirty little trick to optimize the performance of the code for inserting and formatting freeform shapes on a worksheet using VBA.

    As a little bonus, today’s post also includes a tiny Excel tool to easily split continuous texts into a list of words and their count, i.e. the data structure needed for the word cloud workaround. Of course the tool is provided for free download.

    (more…)

  • Word Clouds with Microsoft Excel

    Create dynamic Word Clouds / Tag Clouds in Microsoft Excel

    Word Clouds in ExcelUnlike Tableau Software, Microsoft Excel provides no native feature to create a word cloud (aka tag cloud), i.e. a visual representation of text data where the font size of a word depicts the frequency of this word in a text.

    Workarounds for creating word clouds in Microsoft Excel are available for free, some of them for almost 10 years already.

    I also made my contribution with the article Wordle Tag Clouds in Microsoft Excel in 2010. All of the workarounds come with some considerable limitations and mine is probably the worst: it requires an Internet connection, needs another click in the webbrowser control and – worst of all – it doesn’t work anymore with Excel 2013, because Microsoft disabled scriptable ActiveX controls on worksheets in Office 2013.

    I am fully aware of the fact that word clouds are a very poor tool for data analysis and business data visualizations. However, they definitely have their place in infographics. Moreover, realizing a word cloud in Excel is an interesting VBA challenge.

    Hence, I decided to create another workaround for word clouds in Microsoft Excel.

    Today’s article introduces my new implementation of word clouds in Excel including the workbook(s) for free download. I will go into the details of my approach in a follow-up post.

    (more…)

  • SQL Saturday BA Edition 2014 in London

    The slides and workbooks of my presentation on “Charts beyond Excel’s Chart Wizard” at SQL Saturday in London 2014

    SQL Saturday BA Edition 2014 in LondonLast Saturday (November 22, 2014), I had the privilege to give a little presentation about charts beyond Excel’s default chart gallery at SQL Saturday BA Edition in London.

    For everyone who attended the session and anyone else interested, here is a zipped folder containing the PowerPoint slides and Excel workbooks I used in my presentation:

    Download SQL Saturday 353 Charts beyond Excels Chart Wizard.zip (6.1 MB)

    Please be advised that there is one workbook missing in this folder: I showed a sneak preview of a Word Cloud realized in Microsoft Excel (see slide 10 of the PowerPoint presentation). I will publish this workbook in a separate blog post within the next few weeks.

    Many thanks to Jen Stirrup for organizing the event and inviting me, to Bob Phillips for suggesting me as a speaker, to Roger Govier for his encouraging words and of course to everyone who took the time to attend my session.

    If you have any feedback or questions, please feel free to leave me a comment here or contact me by email.