Author: Robert

  • Nuclear Power Reactors in your Neighborhood

    How many nuclear power reactors are within a certain radius around your hometown? A Tableau Software Visualization

    Radioactivity - © Thommy Weiss / pixelio.deIn the light of recent events: Do you know how many nuclear power reactors are within a certain radius around your hometown?

    No? Today’s short post provides a Tableau visualization allowing you to explore the nuclear power plants around your hometown. All you need to know is the latitude and longitude of your city. Everything else is a piece of cake. Simply type in the geographical data, select the radius in kilometers and the visualization will provide an overview of all nuclear power plants within this radius and additional information using external links.

    Surrounded by Nuclear Power Reactors?

    How to use this visualization

    • Organize the latitude and longitude of your hometown. Here is one tool that helps you getting the data: Lat / Long Detection
    • Type in the latitude and longitude into the 2 input fields at top left of the visualization
    • Select a radius in kilometers at top right of the visualization
    • Click on a data point of the map to get additional information on the selected reactor from The World Nuclear Association in your Internet browser
    • Click on a bar of the bar chart to filter the data by the current status

    What you should be aware of

    • The geographical data is jittered. Many power plants have several reactors close to each other. In order to make them visible on the map, I slightly jittered the data.
    • The data is taken from The World Nuclear Association. The reactors of Fukushima and other reactors in the world that have been shut down in the meantime still have the  current status “operating” in the database.

    Many thanks again to Giedre Aleknonyte for taking the time to review the workbook.

    Stay tuned.

  • Tableau Quick Tip #1 – The Summary Card

    Support your ad-hoc analysis and exploration of new data with Tableau's Summary Card

    Intro Tableau Summary CardI decided to start a new little category of posts here on Clearly and Simply: Tableau Quick Tips. Today’s post could be the first one in a series of very short articles describing some of the little nuggets in Tableau’s functionality.

    Let’s give it a try with a quick hint on Tableau’s Summary Card.

    (more…)

  • Range Filter Slider Control in Microsoft Excel

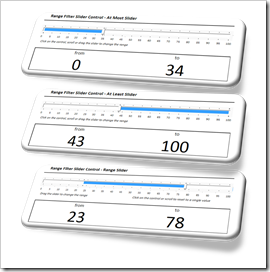
    How to use the Microsoft Slider Control to implement a range filter input feature in Microsoft Excel

    Intro Microsoft Slider ControlAlmost every Excel workbook needs some way of user interaction (maybe except for the Excel models serving solely as the reporting front-end of a database). The users changes parameters, sets filters, triggers actions and so forth.

    The most common way of user interaction in Excel is directly typing in values in a cell. Form controls like scrollbars, spin buttons, radio buttons, combo boxes, etc. are the next step of more convenient interactivity. ActiveX controls provide more flexibility than form controls, but they come with there own disadvantages and usually form controls are the way to go.

    However, there is one use case that cannot be covered with a standard Excel form control: selecting a range. Frequently required, especially for filtering data, e.g. a reporting period or products within a certain price range, etc.

    Sure, you can define 2 input cells, 2 spin buttons or 2 scrollbars to let the user select a range.Though, there is no standard Excel form control to select a range within one single control.

    However, Microsoft provides a less known ActiveX control to select a range. Today’s article describes a how-to tutorial on using the Microsoft Slider Control in Microsoft Excel workbooks. As always, including the Excel workbook for free download.

    (more…)

  • The Next Level of Interactive Microsoft Excel Dashboards

    A highly interactive Microsoft Excel Replica of Tableau’s Seattle Real Estate “Around the Sound” Dashboard

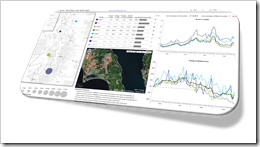
    Around the Sound Dashboard - IntroA couple of weeks ago I had the privilege to contribute to Chandoo's great Excel School. Chandoo and I discussed Excel dashboards in general and how to add interactive features. If you are subscribed to the dashboard module of Chandoo's Excel School, you will soon be able to watch the whole interview.

    Prior to our discussion, I prepared a simple interactive dashboard based on an example taken from the Tableau Software Visual Gallery: Around the Sound – Seattle Real Estate Prices. After our interview, I spent some more time with the model and enhanced this dashboard with more analytical features.

    We already had a post discussing interactivity on Excel dashboards: Bluffing Tableau Actions with Excel. However, the model I developed subsequent to my discussion with Chandoo includes more, hopefully helpful functionality. Thus, I thought you might be interested.

    Today’s post describes the enhanced model and provides the Excel workbook for free download. 

    (more…)

  • Excel Multiple Value Filters with Invert Selection

    How to enhance a multiple value filter check box control with an invert selection option in Microsoft Excel

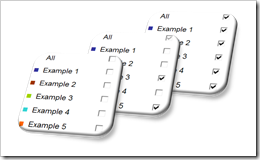
    Invert SelectionThe comments and emails I received on the recent post Excel Dashboard Controls – Multiple Value Filters reinforced my conclusion that the original idea of providing a feature to switch back to a previous selection is more confusing than helpful.

    However, there is another option to really improve the functionality of multiple value filters. Leonid, one of my few but faithful readers was kind enough to share a very interesting idea: add an additional input feature to let the user invert the actual selection.

    Leonid provided 2 different solutions. Number 1 is a simple inversion symbol with additional explanatory text. Clicking on the symbol inverts the actual selection of filters:
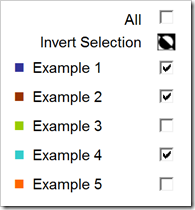
    Invert Selection V01

    The VBA code triggered when clicking on the symbol is straight forward:

    Sub InvertFilters()
    Dim rng_cell As Range
        For Each rng_cell In Range("myActualFilter")
            rng_cell.Value = Not rng_cell.Value
        Next rng_cell
        Range("myCheckBoxAll").Value = _
                 Application.WorksheetFunction.And(Range("myActualFilter").Value)
    End Sub

    The code simply inverts all target values of the check boxes from TRUE to FALSE and vice versa.

    Here is the workbook for free download:

    Download Multiple Value Filter Control with Invert Selection v01 (Microsoft Excel 2003, 91K)

    If the additional row bothers you, you may want to look at Leonid’s alternative option: use a hyperlink on the symbol to provide a tooltip (”Invert Selection”):
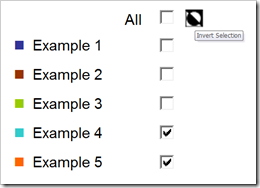
    Invert Selection V02

    There is an additional cell and some more code necessary (on the dashboard worksheet), but the implementation is still pretty straight forward. Here is the workbook:

    Download Multiple Value Filter Control with Invert Selection v02 (Microsoft Excel 2003, 96K)

    Leonid, many thanks for sharing your ideas here and for your workbooks. Your contributions are highly appreciated.