S-Shaped Function in Microsoft Excel

A ready-to-use template for an S-shaped Function in Excel
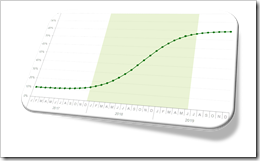
S-shaped function ExcelThe previous post S-Shaped Function in Tableau discussed and provided the implementation of a customizable, i.e. user-defined S-shaped function in Tableau Software.

In the introduction to this post I wrote: “Having a ready to use S-shaped function in Tableau is a must-have for your Advanced Analytics Toolbox.”

This applies to Microsoft Excel, too. Maybe even more.

There are quite a few different S-shaped functions in Excel available on the Internet. The first implementation I saw was a post by Juan C. Mendez back in 2007. Unfortunately Juan’s site is down now, but an archived version is still available here. Others built upon Juan’s approach, like Mathias over at Clear Lines Consulting and this site is still up.

Juan and Mathias used a different formula than I do (in Tableau and in Excel), but the result is pretty much the same. The only new feature in my implementation is the option to highlight the period of fast growth of the S-shaped function with a reference band.

So, nothing really new under the sun in this post, but – for the sake of completeness – here is my Microsoft Excel template of an S-shaped function for free download:

Download S-shaped Function (Microsoft Excel 2007-2016 workbook, 26K)

If you are interested in how to use the parameters to shape the curve, please refer to the previous post S-Shaped Function in Tableau.

More things to come soon.

Stay tuned.

Comments

10 responses to “S-Shaped Function in Microsoft Excel”

  1. Gerardo Avatar
    Gerardo

    I know this is a very old post, however I hope I can still get an answer.
    How can I enter the start and end dates in the excel file, as the Tableau example??
    Thanks!!

  2. Robert Avatar

    Gerardo,
    just change the value in cell C13 on worksheet [Calculations].

  3. Gerardo Avatar
    Gerardo

    Thanks!
    And just erase or add new dates, according to the project times?

  4. Robert Avatar

    Gerardo,
    correct. Simply adjust the range on worksheet [Calculations] as needed and copy the formulas. Make sure the data sources of the chart cover the entire data range if you added more rows.

  5. Shayan Avatar
    Shayan

    Thanks for the brilliant post. Can you please explain a bit on what exactly is this reference band?

  6. Robert Avatar

    Shayan,
    the reference band is simply an additional visual element in the chart and not really necessary for the S-shaped function. The idea is to highlight the period between the start of the faster growth and the period when the function starts converging towards the target value. In a nutshell: it is an additional visual element. If you don’t like it, you can simply delete the data series of the area chart from the diagram.

  7. Oliver Haas Avatar
    Oliver Haas

    Dear Sirs,
    question: may I use aforementioned xls-spreadsheet “S-Shaped Function in Microsoft Excel” for further use in my scientific studies? I am in my doctoral.
    Thanks for a quick reply.
    Best regards Oliver Haas

  8. Robert Avatar

    Oliver,
    thanks for asking. All content on this blog (including the workbooks for download) is published under a Creative Commons License (see button and link on the left side of the blog). You are free to use the content for your own work if you agree to the terms stated there.

  9. Kirty Avatar
    Kirty

    Hi,
    Can the curviness parameter be adjusted to any value to suit the right distribution that one is looking for?
    Thanks

  10. Robert Avatar

    Kirty,
    as all other function parameters, the curviness can be adjusted with the vertical scroll bar right to the number in cells D8:E8.

Leave a Reply

Your email address will not be published. Required fields are marked *