Use Parameters and Table Calculations in Tableau 6 for a Site Catchment Analysis of Germany
 For a recent post called Calculated Fields in Tableau I used a site catchment analysis of Germany to explain how to use and take advantage of Calculated Fields in Tableau. The example posted back then was produced with Tableau 5.2.
The main disadvantage of that workbook is the fact that you have to change a constant in a Calculated Field if you want to switch to another center location for the site analysis. Inconvenient and even impossible if you only have the Tableau Reader available.
With version 6, available since November 10, 2010, Tableau introduced an extremely powerful new feature: Parameters. Parameters are user-defined constants that can be used in Calculated Fields. They can be entered by the user of the workbook either on worksheets or dashboards, are valid throughout the whole workbook (e.g. they are global) and can be used in any Calculated Field. Thus, it wasn’t far to seek that with parameters Tableau 6 would easily overcome the main drawback of the Tableau 5 site analysis workbook.
Today’s post shows how to transform the site analysis workbook to Tableau 6 using parameters. As usual including the Tableau Public workbook for direct access and free download.
The Idea and Implementation of the Tableau 5 Site Analysis
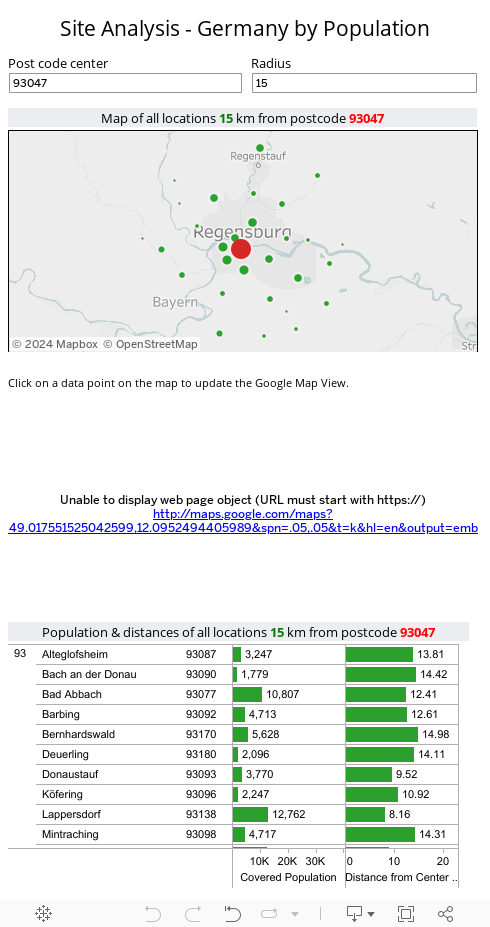
The basic idea of the site catchment analysis was calculating and visualizing the German population living within any given distance (“the radius”) around any given postcode (“the center”) as the crow flies.
The implementation used different Calculated Fields. The most important ones retrieved latitude and longitude of the selected center from the source data using Tableau’s pass through functions (RAW_SQL) and a mathematical formula for calculating the distance between the center and all other locations using the spherical law of cosines.
You will find a more detailed description of all Calculated Fields in the original article Calculated Fields in Tableau.
The Drawbacks of the Tableau 5 Site Analysis
The Tableau 5 workbook came with 3 major disadvantages
- First and foremost you couldn’t easily switch to another center location. The postcode of the center was defined as a constant in a Calculated Field. If you wanted to see the results for another postcode, you had to edit this Calculated Field.
- The pass through functions (RAW_SQL) made it impossible to publish the workbook on Tableau Public, since Tableau Public does not support workbooks using Custom SQL statements.
- An additional disadvantage appeared after the introduction of Tableau 6: the Tableau 6 data engine does not support RAW SQL statements on the Tableau Extract. In other words, you can still use the existing Tableau 5 workbook with Tableau 6, but you cannot refresh the extract.
Well, number 2 and 3 may or may not be a problem. However, disadvantage number one was really an obstacle.
The Implementation in Tableau 6
Here are the main changes in the Tableau 6 version of the workbook:
Parameters
The first idea for transferring the workbook to Tableau 6 is obvious: take advantage of the fantastic new Tableau feature “Parameters”.
Instead of using a constant in a Calculated Field, we create a parameter called [Center] based on a list of values coming from another Calculated Field called [PLZ5_str] (the postcode). Since we are talking about more than 8,000 postcodes, we set the parameter control to a Type-In-control. After creating this parameter, the rest is a piece of cake: simply replace the original constant Calculated Field [Center_PLZ5] by the new parameter in all Calculated Fields. Parameters can be used in Calculated Fields just like fields from the source data or other Calculated Fields.
In the Tableau 5 version we used an at-most-filter to define the radius of the site analysis. That was fine, but we will use a parameter for the radius in the Tableau 6 version as well. Create a new parameter called [Radius], set the data type to Integer, set allowable values to Range and define a minimum of 0 and a maximum of whatever you find appropriate. Later on we will use this parameter in another Calculated Field and get rid of the global filter [Distance] used in the Tableau 5 version.
Table Calculations instead of RAW SQL pass through functions
Replacing the RAW SQL functions by table calculations requires a complete new logic of the Calculated Fields used in the workbook. There is one intermediate step necessary to get from the latitude and longitude in the source data to the geographical data of the center:
[Lat_Center]:
IF [PLZ5_str] = [Center] Then
[Latitude]
Else
0
End
This Calculated Field assigns the latitude only to the center location. All other locations get a zero from this Calculated Field. [Long_Center] is defined accordingly.
[Lat_Center_Global]
TOTAL(SUM([Lat_Center]))
This Calculated Field is aggregating all results of the defined field [Lat_Center], i.e. it is summing up the latitude of the center and a lot of zero values (all other locations). Again [Long_Center_Global] is defined accordingly.
We now have the values of the latitude and the longitude of the center in 2 Calculated Fields without using a pass through function (RAW SQL).
Next step is changing the Calculated Field [Distance].
[Distance]
ROUND(6371 *
ACOS(SIN(RADIANS([Lat_Center_Global])) *
SIN(RADIANS(SUM([Latitude]))) + COS(RADIANS([Lat_Center_Global])) *
COS(RADIANS(SUM([Latitude]))) *
COS(RADIANS(SUM([Longitude])) – RADIANS([Long_Center_Global]))),2)
Please notice that you have to aggregate the latitude and longitude of the locations coming from the source data to make this function work. [Lat_Center_Global] and [Long_Center_Global] are already aggregations (see above) and you can’t mix aggregate and non-aggregate functions in one calculation.
And here is exactly where we bring a limitation into our workbook. This is working fine as long as you are on the lowest aggregation level, i.e. on the level of [PLZ_5]. A further aggregation is not possible, since we are already aggregating on this level. See below for the resulting consequences from this limitation.
The next step is defining a Calculated Field to be used as a filter:
[Is_Within_Radius]
IF [Distance] <= [Radius] Then
1
Else
0
End
This function returns a 1 if the location is within our defined distance from the defined center. Otherwise it returns a zero. We will use this Calculated Field as a filter on our worksheets to only include the locations in our views that are within the radius.
Finally we define a Calculated Field to sum up the covered population:
[Covered_Population]
SUM([Population])*[Is_Within_Radius]
That’s it.
All other Calculated Fields ([PLZ_str], [PLZ5_str], [Location_type], [URL_link], [Map_Population]) stay as they were, except for the fact that the parameter [Center] is used instead of the Calculated Field with the constant postcode.
Changes to the Dashboard
The new logic described above requires some changes to the dashboard of the workbook as well. Instead of the filter to set the radius we have now 2 parameter controls on the dashboard.
The logic of aggregating the data already on the level of latitude and longitude of the center makes it impossible to do further aggregations of the data. Thus, the views showing the results by state and by PLZ_2 (first 2 digits of the postcodes) had to disappear from the dashboard.
I can live with that, but I am truly unhappy with the fact that I failed hard in trying to create the simple 3 numbers on top right of the Tableau 5 dashboard, showing the main results of the analysis (total population covered, population covered in % of total population Germany and covered locations). From my point of view this is a major disadvantage of the logic implemented in the new workbook.
As I said, “I failed hard”. Maybe I am missing something and you have a better idea (see below).
The Workbook on Tableau Public
Here is the workbook on Tableau Public for direct access and free download:
The Drawbacks of the Tableau 6 Version
As already implied in the sections above, the Tableau 6 version of the site analysis has some disadvantages as well:
- No further aggregation of already aggregated measures
In the Tableau 6 workbook, latitude and longitude of the center are calculated using aggregation functions. The Calculated Fields [Distance] and [Is_Within_Radius] are based on the results. Thus, it is not possible to do further aggregations. All views have to be based on the deepest level of aggregation (i.e. PLZ5_str). A simple overview, e.g. of the sum of the population covered or the sum of the locations covered is not possible. - No triggering of an action from a parameter
It is not possible to trigger an action from the change of a parameter. Thus, if you change the center location using the parameter [Center], the Google Map View will not be updated. The user has to click on the center on the map to update the view in the web page on the dashboard. - The performance
I have to admit that I haven’t made any reliable performance comparisons of the two versions. However, I do have the impression that the Tableau 6 workbook is slower than the Tableau 5 version. From my point of view this makes sense: The version 5 workbook uses 2 simple RAW SQL statement to retrieve the latitude and longitude of the center from the source data whereas the version 6 workbook calculates the center’s geographical data for all data rows using table calculations. This different logic suggests the assumption that the logic in the Tableau 6 workbook needs more time for computation.
Ideas anyone?
To be honest, I am quite unhappy with the drawbacks of the Tableau 6 version, especially regarding the aggregation problem mentioned above. I liked the display of the 3 simple total numbers at the top of the Tableau 5 version, showing the total covered population (absolute and as a percentage of Germany’s total population) and the numbers of postcodes covered within the defined radius at a glance. In my humble opinion these three dashboard elements provided a very good quick overview of the main results and they are sorely missed in the new version.
I would have loved to include them in the Tableau 6 version as well, but I failed hard. It might well be that I do not see the wood for the trees and missing something quite obvious.
Do you have any ideas on how to overcome this major weakness of today’s showcase? If so, I would highly appreciate if you would take the time to leave a comment and tell me about it. Many thanks!
Acknowledgement
What do you think? Who helped me this time? No surprise at all. The usual suspect again: many thanks to Giedre Aleknonyte for spending some of her precious time meticulously reviewing my workbook and for her great feedback. Thanks Giedre!
What’s next?
I should probably stop writing about what’s supposed to come next here, because I am very often failing in keeping my promises. For instance, at the end of Calculated Fields in Tableau I announced some more Excel articles here.
This time I will, for sure. Thus, for all you Excel aficionados coming here, please stay tuned. There are some interesting Excel models in the pipeline, among other things an Excel version of the site catchment analysis discussed today.
Stay tuned.
Leave a Reply