Choropleth Map Template Brazil

Amendment #2 to Choropleth Maps with Excel: a Map Template for Brazil including an alternative approach
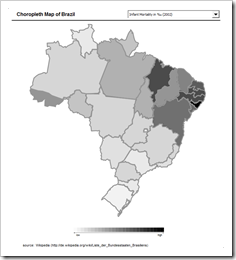
Choropleth Map Brazil - click to enlargeOnce more a Choropleth Map Template arrived (see also Paulo’s Portugal Map).

This time Gabriel Eiras Villa kindly contributed a choropleth map of Brazil:

 Download Choropleth Map Brazil (Microsoft Excel 2003, 129.5K)

But Gabriel has even much more to offer and share. He had a brilliant idea of how to simplify Tushar Mehta's approach:

Gabriel suggested to use one color (e.g. black) and simply change the fill color transparencies of the shapes according to the values of the regions instead of defining a color gradient table and assigning different shades of grey.

Gabriel’s approach has a couple of advantages compared to Tushar's original implementation:

  1. There is no need for organizing a color gradient table with different colors (e.g. grey shades). Simply format all shapes in black (or any color you may choose) and run the macro.
  2. Thus, it is very easy to switch the coloring from shades of grey to any other color. Simply select all shapes, assign a new fill color and run the macro.
  3. The workbook needs less cells and less calculations, has a higher performance and a smaller file size.
  4. Gabriel’s workbook uses by far less VBA code. Tushar’s code is already very lean and efficient (31 lines of code), but Gabriel’s implementation is even leaner (9 lines of code):
    Option Explicit

    Sub UpdateMap()
    Dim myCell As Range

    Application.ScreenUpdating = False
    For Each myCell In _
    Range("MapShapeToTransparency").Columns(1).Cells
    Sheets(1).Shapes(myCell.Value).Fill.Transparency = _
    Application.WorksheetFunction.VLookup(myCell.Value, _
    Range("MapShapeToTransparency"), 2, False)
    Next myCell
    Application.ScreenUpdating = True

    End Sub

Download the workbook for free here:

Download Choropleth Map Brazil with transparencies (Microsoft Excel 2003, 122K)

Muito obrigado, Gabriel.

Gabriel has a blog of his own: Don’t talk about life. His blog is not fully dedicated to visualization or data analysis, but Gabriel provides a couple of posts on Microsoft Excel. The blog is in Portuguese and unfortunately my knowledge of Portuguese is limited to obrigado and desculpe. However, if you speak Portuguese, I recommend to check it out here.

If anyone out there wants to contribute to our little collection of choropleth maps with Excel here on Clearly and Simply: you are most welcome to send in your maps. You will find an email-link on the left column of this blog.

Comments

7 responses to “Choropleth Map Template Brazil”

  1. Gabriel Avatar

    Thanks a lot Robert! Keep up with your excel love.
    Best Regards from Brazil – Gabriel

  2. Fabrice Rimlinger Avatar

    Hi Robert,
    have you tried printing chart using transparency ?
    I obtained a poor quality pattern instead of a nice plain color fill… at least with sparklines.
    Regards from Bucharest

  3. Robert Avatar

    Fabrice,
    many thanks for your comment. I have to admit that I never printed the files posted for download. I just did it after your comment and I agree with you, the version with fill colors looks much better on paper than the transparency version. A disadvantage of Gabriel’s approach, but nevertheless I like the idea, because it has some advantages regarding implementation and usability.
    Well, both versions are available for download now and it is your call which one to use, depending on how often you have to print your dashboard.

  4. Brian Amoureuse Avatar

    Thanks for sharing the map brazil with transparencies.
    its quite useful !

  5. Sol Avatar
    Sol

    Hi Robert,
    I am trying to utilise this with Map shapes I acuired in Visio, I can’t get past the first hurdle and export Visio Map shapes into Excel. I am curious to know how you moved your shapes into excel?
    I can only cut and paste each individual shape which gets a rectangular frame around it and that entire rectangulr shape changes colour (not just the main map shape).
    Any ideas?
    Thanks

  6. Robert Avatar

    Sol,
    thanks for your comment and question.
    I do not have Microsoft Visio available, but maybe the following workaround will help:
    1. Copy the Visio map objects and paste them into a PowerPoint Slide.
    2. Ungroup the Visio objects in PowerPoint (select, right click and ungroup).
    3. A PowerPoint dialog will ask you whether you want to convert the Visio objects. Choose “yes”.
    4. You may have to delete some parts that have been ungrouped like the border of the shape or text boxes. Delete everything but the shape itself.
    5. Finally you have Microsoft Office shapes in PowerPoint and you can assign any fill color you want.
    6. Select and copy all shapes and paste it into your Excel workbook.
    From that point on you can directly follow Tushar’s instructions to create your choropleth map with Microsoft Excel.
    As mentioned, I can not test this workaround since I do not have Visio available, but I hope this will work.

  7. Rob Gamesby Avatar

    This is a great resource, I will use it with my students here in the UK, thanks so much

Leave a Reply

Your email address will not be published. Required fields are marked *